Delineate
Overview of Delineate
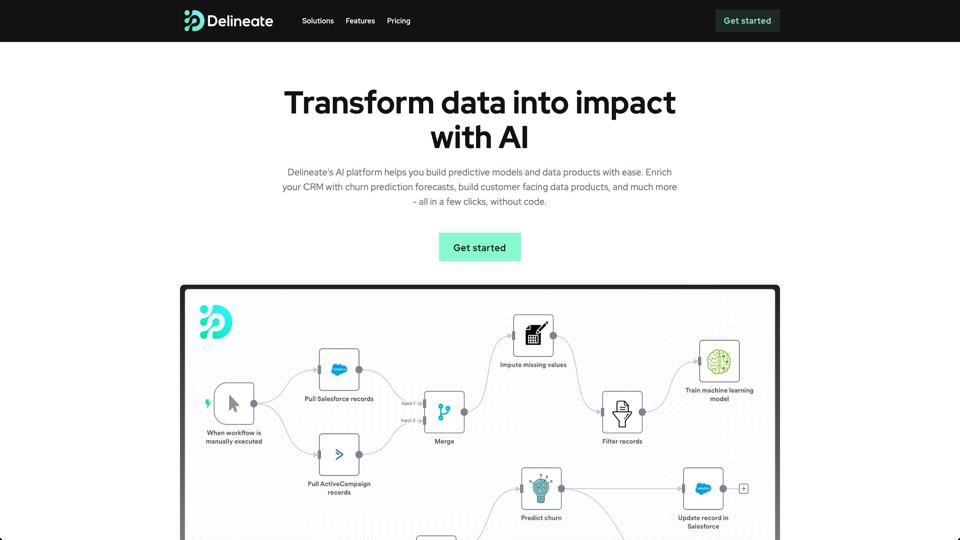
Delineate is a tool designed to enhance data analysis and visualization, primarily aimed at businesses and researchers looking to gain insights from their data. It offers a user-friendly interface that simplifies the process of data exploration and presentation.
Key Features
- Interactive Data Visualization: Delineate allows users to create dynamic charts and graphs that can be manipulated in real-time, aiding in the discovery of trends and patterns.
- Data Integration: The tool supports integration with various data sources, making it versatile for different types of data analysis needs.
- Collaboration Tools: Features that enable team members to work together on data projects, share insights, and make decisions based on collective analysis.
- Customizable Reports: Users can generate tailored reports that can be shared with stakeholders, enhancing communication and decision-making processes.
Pros
- User-friendly interface that is accessible to non-technical users.
- Robust data visualization capabilities that help in uncovering insights quickly.
- Effective collaboration features that enhance teamwork on data projects.
Cons
- Pricing may be a barrier for small businesses or individual users.
- Some advanced features might require a learning curve for new users.
Conclusion
Delineate stands out as a powerful tool for those needing to analyze and visualize data effectively. Its strengths lie in its ease of use, robust visualization options, and collaboration features. However, potential users should consider the cost and the learning curve associated with some of its more advanced functionalities.
Visit Delineate
For more information or to explore the tool, visit Delineate’s website.


