ChartGPT Cadlabs
Overview of ChartGPT
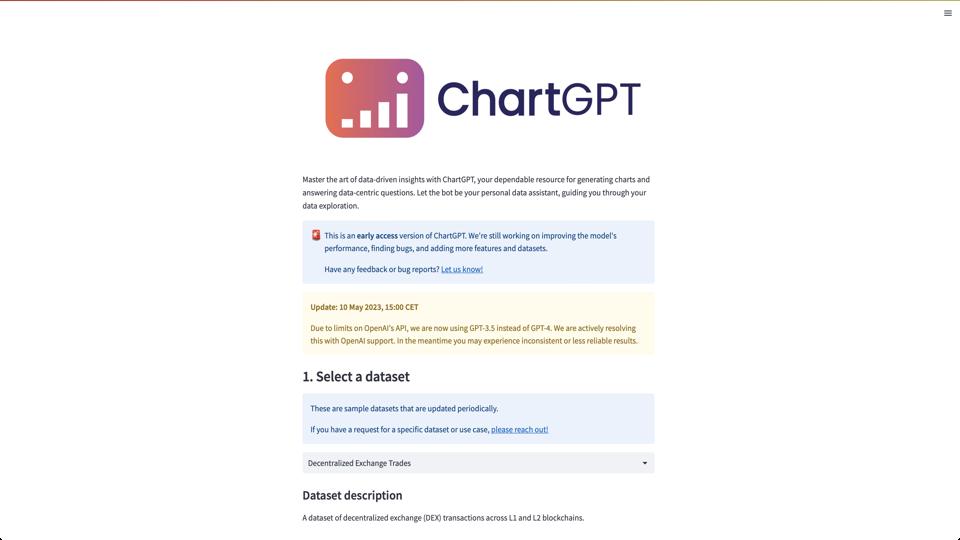
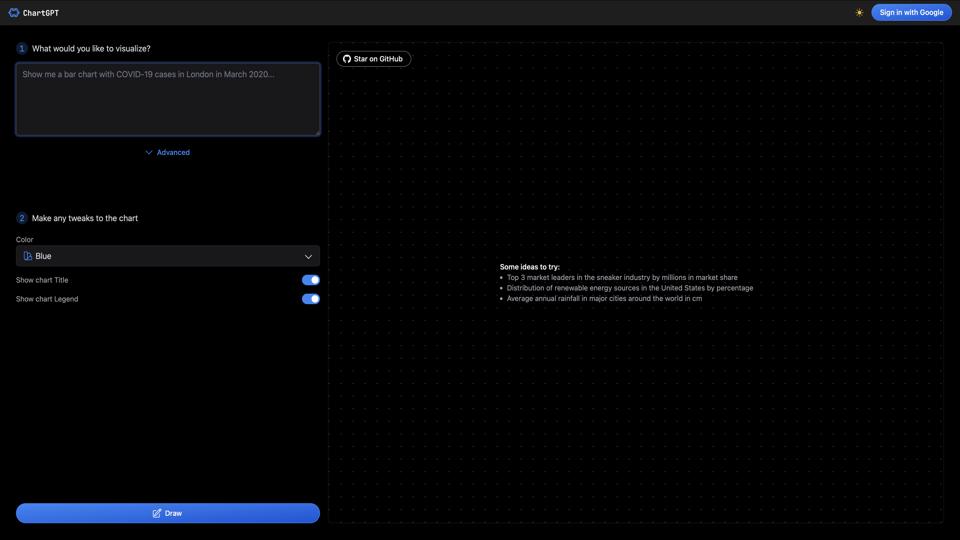
ChartGPT, accessible at chartgpt.cadlabs.org, is a sophisticated tool designed to create charts and visualizations from textual descriptions. This tool leverages AI to interpret user inputs and generate corresponding data visualizations, making it a valuable resource for data analysts, educators, and anyone needing quick visual representations of data concepts.
Key Features
- Text-to-Chart Conversion: Users can describe what they want to visualize, and ChartGPT will generate the appropriate chart type.
- Variety of Chart Types: Supports multiple chart types including bar charts, pie charts, line graphs, and more.
- Customization: Offers options to customize the generated charts, such as changing colors, labels, and data points.
- User-Friendly Interface: The platform is designed to be intuitive, allowing users to quickly generate and modify charts.
- AI-Driven Insights: Provides suggestions and improvements based on the initial input for better visualization.
Pros
- Ease of Use: The tool is remarkably user-friendly, making it accessible even to those with minimal data visualization experience.
- Speed: Generates charts quickly from textual descriptions, which is ideal for presentations or quick analyses.
- Versatility: Suitable for a wide range of applications, from educational purposes to professional data analysis.
Cons
- Limited Precision: The AI’s interpretation of textual inputs may not always align perfectly with user intent, requiring manual adjustments.
- Dependence on AI: Users relying heavily on AI-generated charts might miss out on understanding the underlying data manipulation techniques.
- Customization Limitations: While customization is available, some users might find the options not extensive enough for highly specific needs.
Who Should Use ChartGPT?
ChartGPT is ideal for:
- Educators looking to quickly generate visual aids for teaching data concepts.
- Data analysts needing to produce visualizations for reports or presentations.
- Beginners in data visualization who want to learn through an interactive, AI-assisted platform.
Final Thoughts
ChartGPT represents a significant step forward in making data visualization accessible and efficient. While there are areas for improvement, particularly in precision and customization, the tool’s overall utility and ease of use make it a valuable asset for anyone looking to create quick and effective visual representations of data.
