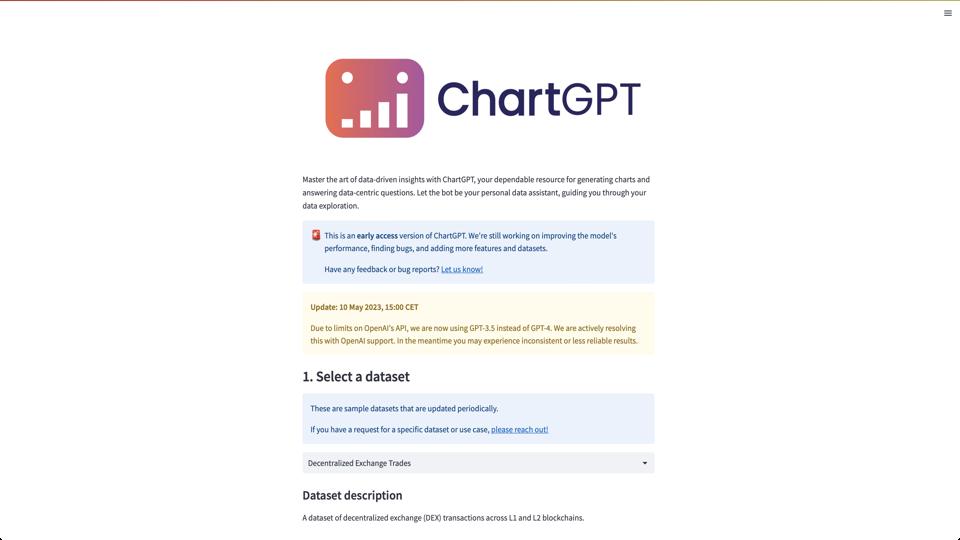
Overview of ChartGPT

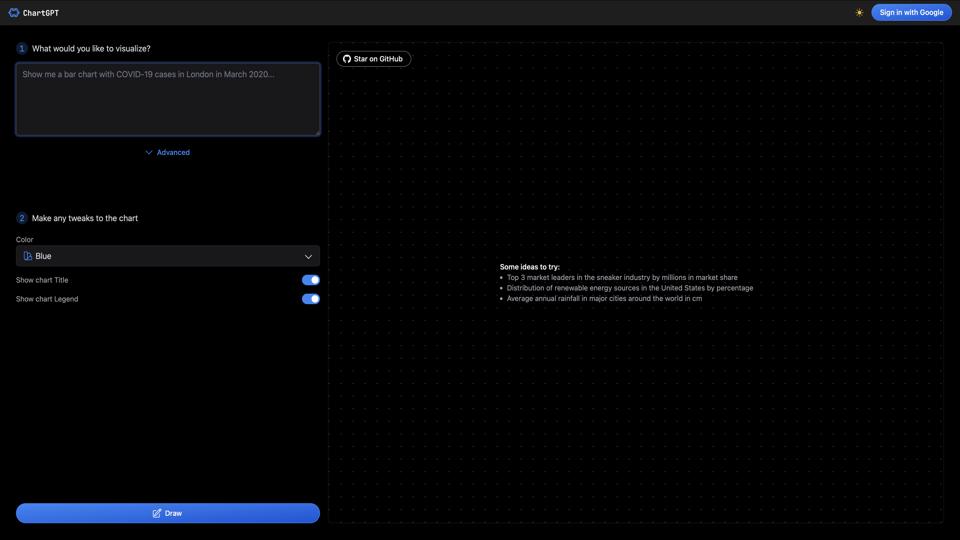
ChartGPT, found at https://www.chartgpt.dev/, is a tool designed to assist users in creating charts and data visualizations. It leverages artificial intelligence to help users design and customize their charts based on their data input and specific requirements.

Key Features

  • AI-Powered Chart Creation: Users can input their data and ChartGPT will suggest the most suitable chart type and design.
  • Customization: Offers various customization options for colors, labels, and other chart elements.
  • User-Friendly Interface: Designed to be intuitive, making it accessible for users with varying levels of technical expertise.
  • Export Options: Allows users to export charts in multiple formats like PNG, PDF, and SVG.

Pros

  • Ease of Use: The AI-driven suggestions make chart creation straightforward, even for those without a design background.
  • Versatility: Suitable for a wide range of chart types and data sets.
  • Customization: Offers sufficient options to tailor charts to specific needs.

Cons

  • Limited Advanced Features: May not meet the needs of users requiring more complex data visualizations.
  • Dependence on AI: Users with specific design preferences might find the AI suggestions limiting.

Who Should Use ChartGPT?

ChartGPT is ideal for:

  • Business professionals needing quick and effective data visualization.
  • Educators and students looking for an easy way to create charts for presentations and reports.
  • Anyone new to data visualization who wants an AI-assisted tool to learn and create.

Conclusion

ChartGPT is a solid choice for users seeking a user-friendly tool to create and customize charts with the help of AI. While it may not cater to advanced users looking for highly specialized visualizations, it serves well for general purposes and educational settings.

Join the AI revolution!
Building the world's finest AI community is no walk in the park, do you want
to be a part of the change? Let's work faster, smarter and better!